
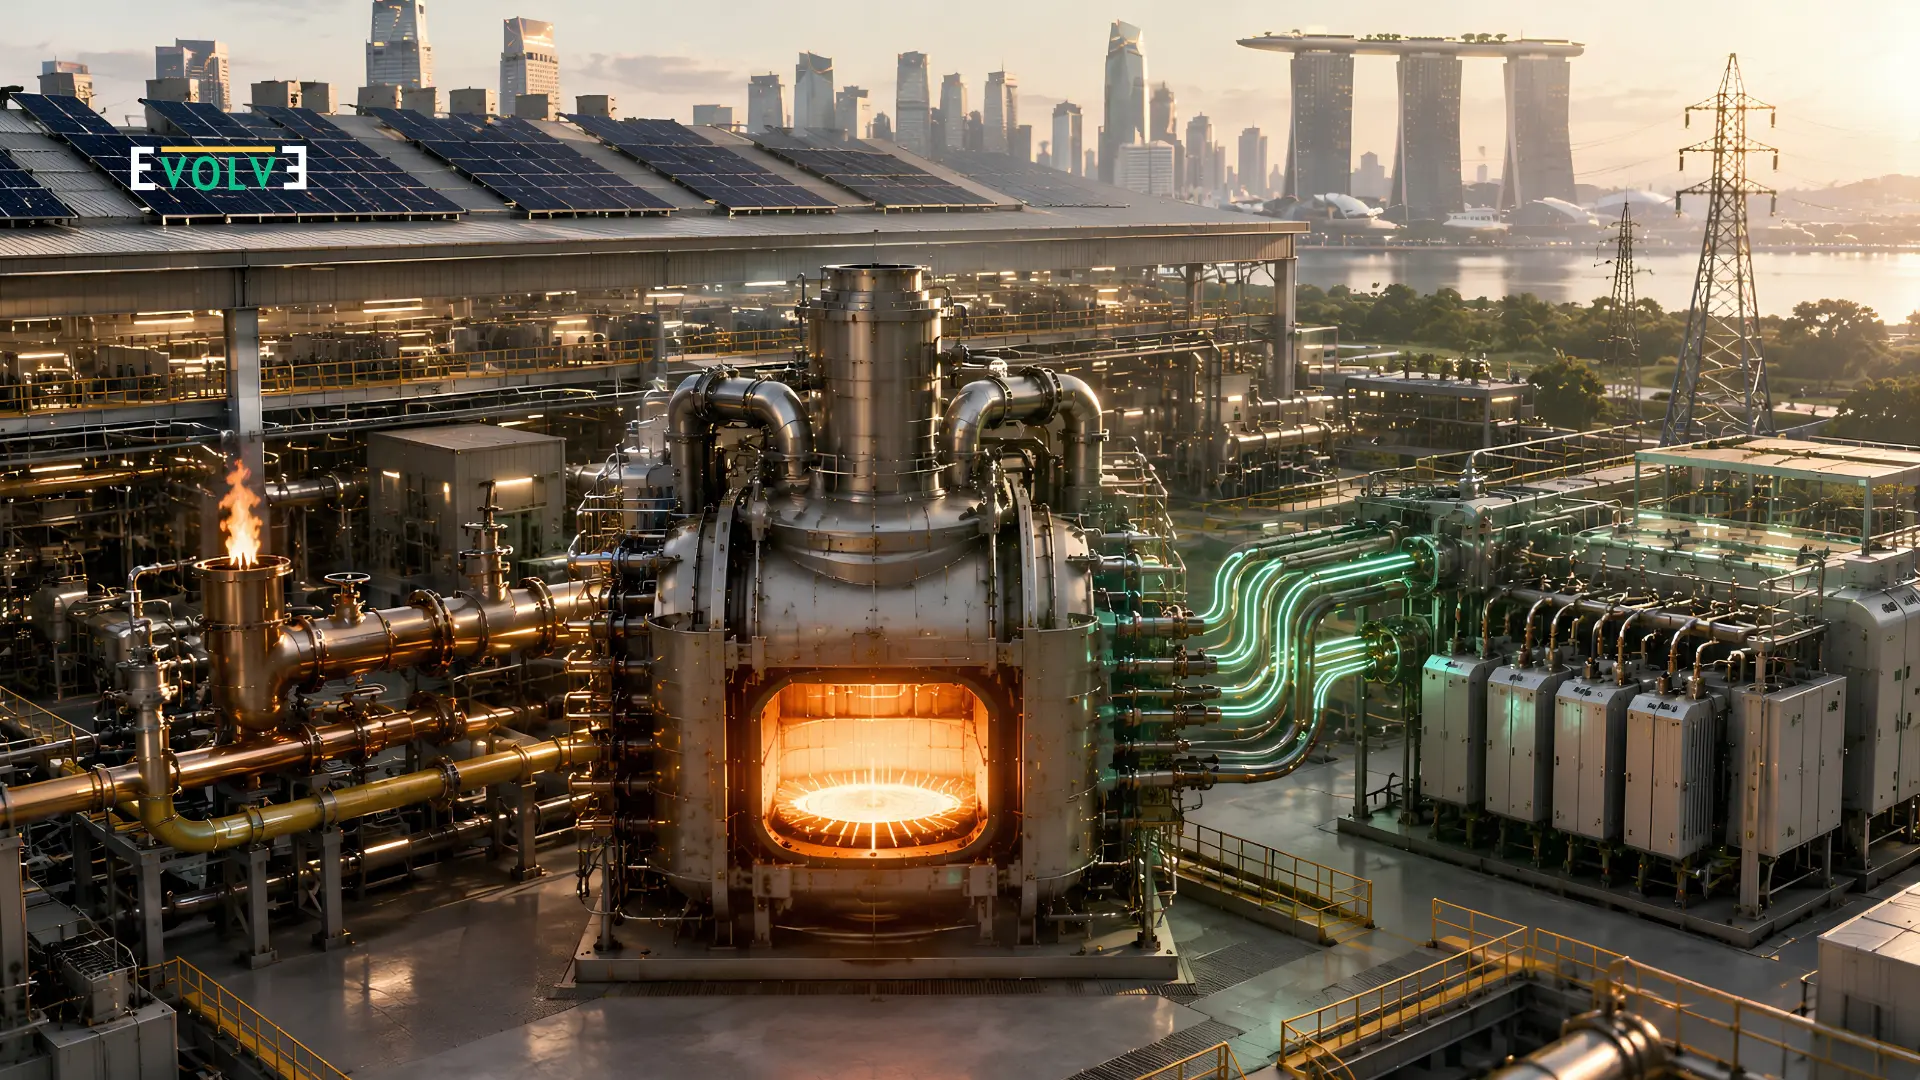
There is a factory in the outskirts of Surabaya that runs 24 hours a day, seven days a week, burning natural gas to heat ceramic kilns to 1,200 degrees Celsius. It has been doing this since 1987. It will keep doing this until someone brings it an alternative that costs less to operate, carries lower regulatory risk, and doesn’t require a complete redesign of its production process. That alternative now exists. The technology is proven. The economics are narrowing rapidly. The regulatory pressure — particularly from the EU’s Carbon Border Adjustment Mechanism — is arriving faster than the factory’s management anticipated.Industrial heat electrification is moving from pilot to commercial scale in 2026. The investment opportunity it represents is large, structurally underexplored, and positioned exactly at the TRL 6–8 range where patient capital generates its strongest returns. The Problem: 25% of Global Emissions Nobody Talks About When people discuss climate tech investment, the conversation gravitates toward familiar categories: solar, wind, electric vehicles, green hydrogen, carbon markets. These are important. They are also well-capitalised relative to their share of the emissions problem. Industrial heat is different. Process heat — the thermal energy required to drive industrial manufacturing — accounts for approximately 20–25% of global final energy consumption. Steel production requires temperatures above 1,500°C. Cement kilns operate at 1,400°C. Chemical reactors, food processing facilities, textile dyeing plants, and ceramic manufacturers collectively consume heat energy at a scale that makes them among the largest industrial emissions sources globally.Approximately 70% of that heat is currently generated by burning fossil fuels — natural gas, coal, and fuel oil. Decarbonising industrial heat is, on a pure emissions basis, one of the highest-impact interventions available in the climate tech landscape. It is also one of the most technically complex — which is why it has attracted a fraction of the capital that has flowed into power generation and transport electrification. That gap is now closing. And the investment opportunity in the gap is significant. The Technology Has Arrived — But Not Uniformly Industrial heat electrification is not a single technology. It is a family of solutions, each appropriate for different temperature ranges and industrial processes, at different stages of commercial readiness. Industrial Heat Pumps — Below 200°C (TRL 8–9) High-temperature industrial heat pumps can now deliver process heat at temperatures up to 160–200°C — sufficient for food processing, dairy, brewing, paper manufacturing, and chemical applications. Commercial-scale industrial heat pumps are operating across Germany, Denmark, and the Netherlands.In Southeast Asia, industrial heat pumps are at TRL 8 in technology readiness but TRL 5–6 in market deployment. The technology is proven. The supply chain, installation expertise, and service infrastructure are still developing in the region. This is precisely the gap that commercial-scale patient capital investment can close.Capital implication: Heat pump deployment in SEA manufacturing clusters is a near-term commercial investment opportunity, not a technology risk. The risk is market and operational — scaling installation capacity and building the service infrastructure that makes industrial customers comfortable committing to the technology. Electric Arc Furnaces — Steel Above 1,500°C (TRL 9) Electric arc furnaces for steel production are fully commercial, already accounting for approximately 28% of global steel production. The world’s largest steel producers — ArcelorMittal, SSAB, Tenaris — are investing in EAF transitions at scale. In Southeast Asia, EAF adoption is accelerating in Vietnam and Indonesia, driven by scrap steel availability and corporate buyers in Europe requiring decarbonised steel supply chains as a procurement condition. Capital implication: EAF transition in SEA is not a technology investment — it is infrastructure and project finance. The opportunity is in the enabling ecosystem: electricity supply agreements, scrap collection networks, and financing structures that make EAF transitions affordable for mid-sized steel producers. Electric Kilns — Cement and Ceramics at 900–1,400°C (TRL 6–7) Electric kilns for cement and ceramic production are the most commercially exciting frontier in industrial heat electrification. The technology has been demonstrated at pilot scale. Several companies in Europe and North America have completed TRL 6 demonstrations — proving electric kilns can reach temperatures required for cement clinker and ceramic firing. Full commercial deployment at TRL 8–9 has not yet been achieved at scale. The gap between successful pilot and first commercial installation is exactly the missing middle that patient capital is designed to bridge. Capital implication: Electric kiln companies at TRL 6–7 are at the optimal entry point for patient capital with a 7–9 year hold horizon. Technology risk is substantially resolved. Commercial risk — the first full-size installation, replicability demonstration, first commercial contracts — is the risk patient capital is structured to absorb. Plasma Furnaces and Electrode Heating — Above 1,400°C (TRL 5–6) For the highest temperature applications, plasma furnaces and advanced electrode heating represent the frontier of electrification technology. Plasma-based steel and cement production has been demonstrated at lab and small pilot scale. Several well-funded startups in Sweden, Germany, and the US are advancing these technologies toward TRL 7. Capital Implication: Early opportunities for deep technology funds that have greater investment periods and higher technical risk tolerance. This is the pipeline that will produce TRL 6 investments in Evolve Venture Capital’s sweet spot during the period of 2028 to 2032. The Economics Are Turning Industrial heat electrification has historically faced one fundamental barrier: electricity costs more than natural gas per unit of energy. Three forces are now changing this simultaneously. Renewable electricity costs are falling. In Southeast Asia, utility-scale solar electricity is below $0.03/kWh in the best-resourced markets. As industrial facilities access power purchase agreements for renewable electricity, the cost of electrical heat generation moves toward parity with fossil fuel alternatives. Carbon costs are rising for fossil alternatives. The EU’s Carbon Border Adjustment Mechanism — entering full implementation in 2026 — applies a carbon cost to imports of steel, cement, aluminium, fertilisers, and hydrogen into the EU. For Southeast Asian manufacturers exporting to Europe, CBAM creates a direct financial cost for fossil-fuel-based production that electric alternatives avoid. CBAM is effectively an externally imposed carbon price on SEA industrial production —

India At 80: How Viksit Bharat’s Green Transition Is Creating The Decade’s Biggest Investment Opportunity
Seventy-nine years after independence, India stands at an inflection point that has no historical parallel: the world’s most populous country, with the world’s third-largest economy, is attempting to decarbonise at a speed and scale that no nation has previously attempted.The Viksit Bharat 2047 framework — India’s roadmap to its centenary of independence — explicitly integrates green transition as an economic development priority, not an environmental one. For climate investors, this distinction is critical. When clean energy is infrastructure policy, the investment risk profile changes fundamentally.This piece examines the data behind India’s green transition, the specific investment opportunities it creates, and why Evolve Venture Capital — a Southeast Asia-focused climate tech fund — watches India as closely as any market in our primary investment geography. India At 80: A Different Economy Than 1947 The economic transformation of 79 years of independence provides the context for understanding why India’s green transition is structurally different from that of any other major economy.India in 1947 inherited a per-capita income of ₹274 per year, an industrial base oriented toward colonial export, and electricity access below 5% of the population. By 2026, India’s GDP exceeds $4.3 trillion, its per-capita income has grown more than 30-fold in real terms, and electricity access has reached over 99% of households.That development trajectory created the energy demand that now drives India’s clean transition. India’s electricity consumption has grown at an average of 6.5% per year over the past decade. Meeting that demand growth with clean rather than fossil energy — while simultaneously replacing existing fossil generation — is the core engineering and financial challenge of India’s green transition.The challenge is real. So is the investment opportunity it creates. The 500GW Target: What the Numbers Actually Mean India’s commitment to 500GW of installed renewable energy capacity by 2030 is the centrepiece of its climate finance story. Understanding what that number means in practice requires moving beyond the headline.Present Position of India: Till mid-2026, India has surpassed its 220GW mark for its cumulative capacity of renewable energy generation. Out of which 140 GW comes from solar sources and 47 GW is generated through wind power.500 GW needs:The difference between 220 GW and 500 GW is 280 GW, to be added in about four years’ time. This will need an addition of about 56–70 GW per year, which India has not been able to achieve till date but 2025 witnessed about 38 GW being added, which is its best performance ever.The transmission constraint: Renewable energy capacity alone does not equal renewable energy delivery. The transmission infrastructure required to carry solar and wind electricity from generation-rich states — Rajasthan, Gujarat, Tamil Nadu — to high-demand centres in Maharashtra, Uttar Pradesh, and West Bengal requires an estimated $50–80 billion in transmission investment that is not yet fully committed or contracted.The storage constraint: Variable renewable energy requires storage to be dispatchable. The capacity for battery storage in India as of mid-2026 comes to roughly 4GW, which is a mere fraction of what is needed to accommodate the intermittent energy generation of 500GW. While there has been rapid battery storage deployment, more still needs to be done.The investment implication: The 500GW target creates investment opportunity not just in solar and wind generation, but in the entire enabling stack: transmission infrastructure, grid-scale storage, flexible load management, smart grid technology, and the digital systems that manage real-time grid balancing. Each of these categories represents a distinct climate investment vertical directly enabled by the 500GW commitment. Viksit Bharat 2047: The Investment Framework The Viksit Bharat framework is India’s most ambitious policy commitment since liberalisation in 1991. It is a comprehensive development blueprint targeting India’s centenary of independence — and it places green transition at the centre of the economic development agenda.For climate investors, the most significant aspect of Viksit Bharat is not its environmental ambition. It is its structural integration of clean energy with economic competitiveness.Solar Villages: The scheme to ensure that 100% of the electricity comes from renewable sources in rural villages is one of the infrastructure schemes but with climate finance features. It generates demand for decentralized solar energy, battery storage and energy management systems at the village level – a huge market which is currently underserved.Industrial Decarbonisation Mandate: Viksit Bharat’s manufacturing competitiveness pillar includes explicit targets for MSME energy decarbonisation. India has approximately 63 million MSMEs, accounting for roughly 45% of industrial energy consumption. Decarbonising that base is a capital deployment opportunity of extraordinary scale.EV Transition: India’s EV adoption trajectory — led by two-wheelers and three-wheelers, followed by commercial fleets and passenger vehicles — creates demand for charging infrastructure, battery manufacturing, and grid management technology that extends the clean energy investment universe well beyond power generation.The Capital Gap: Credible estimates of India’s annual climate investment requirement through 2030 range from $150 to $170 billion per year. Current annual climate-related investment in India runs at approximately $50–60 billion. The gap — $90–110 billion per year — represents the structural market opportunity that Viksit Bharat is designed to catalyse private capital into filling. Green Hydrogen: India’s Decade-Defining Wildcard India’s National Green Hydrogen Mission is one of the most significant single government commitments to green hydrogen technology in the world.The commitment: ₹19,744 Crore (approximately $2.4 billion) in production-linked incentives, demand creation mandates, and electrolyser manufacturing support.The target: 5 million tonnes per year of domestic green hydrogen production by 2030, with an initial mandate requiring fertiliser producers and petroleum refineries to blend green hydrogen into their processes.The manufacturing play: India is building electrolyser manufacturing capacity in Rajasthan and Gujarat, supported by Production Linked Incentives designed to make India a net exporter of electrolyser technology by 2027. This is the same industrial policy playbook that made India a major solar module manufacturer — and it has a credible chance of working for electrolysers.The cost trajectory: India’s combination of cheap renewable electricity (among the lowest solar LCOE globally) and improving electrolyser costs creates a pathway to green hydrogen production at approximately $1.50 per kilogram by 2030. At that cost level, Indian green
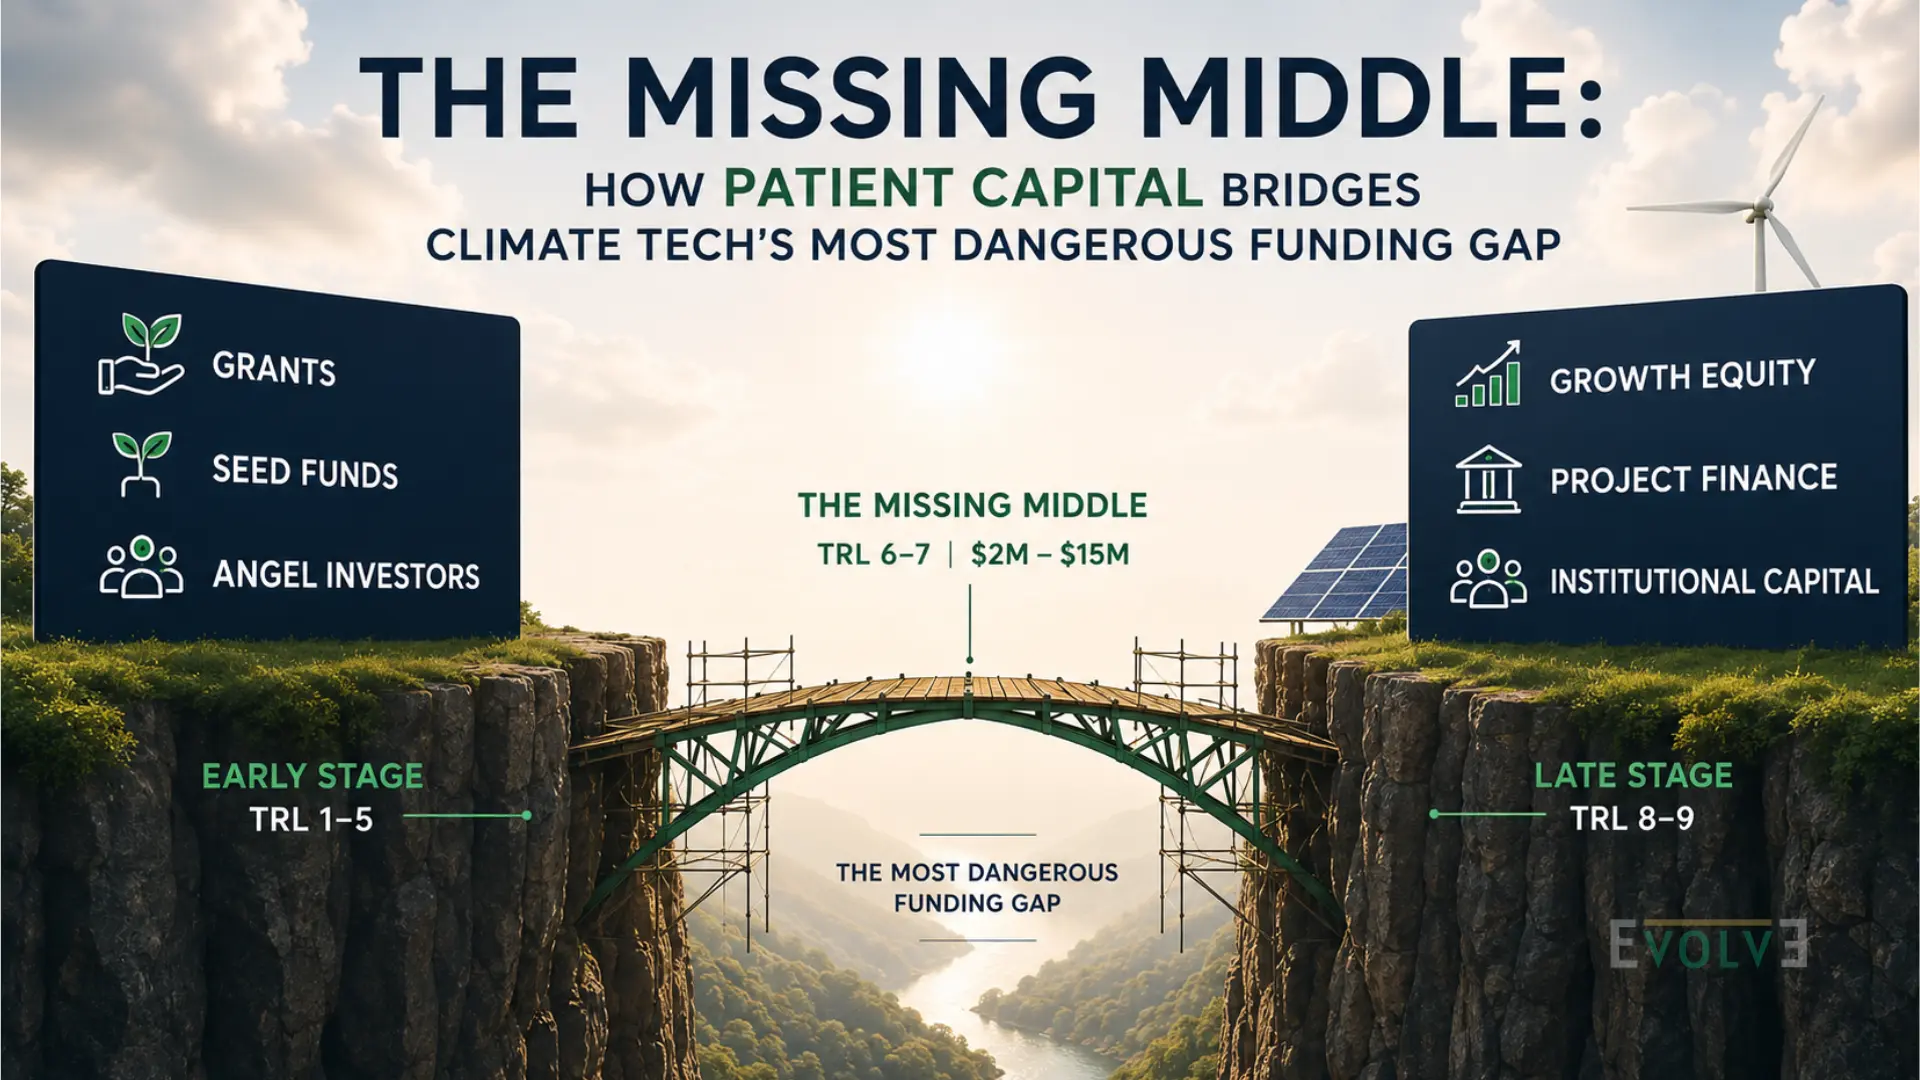
The Missing Middle: How Patient Capital Bridges Climate Tech’s Most Dangerous Funding Gap
The Phone Call Nobody Returns Mira had spent four years building a biochar carbon removal system for smallholder farms in Central Java. By 2025, her technology worked. Not in a lab — in the field, across 14 farming cooperatives, with independently verified carbon sequestration data and an MRV audit that passed first review.She had TRL 6. She had proof. She had a pathway to 300 additional cooperatives within 18 months if she could raise $4 million.She couldn’t.Not because the technology was unproven. Not because the market wasn’t real. Not because the team was weak.She couldn’t raise because she was standing in the gap. Too commercially advanced for most climate grants and seed funds. Too early and too capital-intensive for growth equity and institutional PE. In precisely the moment her company needed bridge capital the most, the bridge didn’t exist.In climate finance, this gap has a name: the missing middle.And it is the single most dangerous place for a climate tech company to stand. What Is The Missing Middle? The missing middle is the funding gap that exists between a climate technology’s successful proof-of-concept and its first commercially viable deployment at scale. It typically sits between approximately $2 million and $15 million in total capital requirement — the range where a company has validated its technology, demonstrated real-world impact, and identified a clear path to commercial revenue, but hasn’t yet built the revenue track record or asset base that growth equity and institutional capital require. On one side of the gap: grants, climate accelerators, angel investors, and early-stage impact funds. These players are comfortable funding technology validation getting a solution from concept (TRL 1) to proven pilot (TRL 5 or 6). This capital is abundant relative to the stage it serves. On the other side: growth equity funds, project finance vehicles, development finance institutions, and late-stage climate VCs. These players want commercial proof — revenue, contracts, audited financials, enterprise customers. They fund from commercial deployment (TRL 8-9) onward. This capital is also abundant. In the middle: TRL 6, 7, and the early phase of TRL 8. Technology proven at pilot scale. Commercial deployment not yet achieved. Revenue real but not yet scaled. This is where capital is genuinely, structurally scarce. The missing middle is not a funding problem in the traditional sense. The capital exists. The issue is that the risk-return profile of a company in the missing middle fits nobody’s mandate cleanly — and so everybody passes. Why The Funding Gap Exists: A Structural Problem, Not A Market Failure Understanding why the missing middle exists requires understanding how different capital pools are structured — and why those structures systematically exclude the companies that need capital most. The Early-Stage Problem Climate grants and seed funds are structured to fund exploration and validation. Their success metric is technological proof — demonstrating that an idea works. Once a company has proven the technology at pilot scale and is ready to move toward commercialisation, it has typically outgrown what seed capital is designed to fund. Seed investors who came in at TRL 3 or 4 are looking for their next deal, not a larger follow-on at TRL 6. The Growth-Stage Problem Growth equity and institutional capital are structured around financial risk, not technology risk. They need to model cash flows, underwrite revenue growth, and price the investment based on comparable commercial transactions. A climate tech company at TRL 6 or early TRL 7 has technology proof but limited financial history. It can’t be underwritten on DCF. It doesn’t fit comfortably into the financial risk frameworks that growth capital uses. And because climate tech commercialisation timelines are longer than most sectors, the exit horizon required doesn’t match the 3-5 year return cycle that most growth funds target. The Result According to a 2025 survey by the Global Innovation Lab for Climate Finance, 51% of active climate investors identified the pilot-to-scale gap as the number one bottleneck to climate tech deployment globally. Not technology readiness. Not policy uncertainty. Not market demand. The gap between the capital that funds proof and the capital that funds scale. The companies in this gap are not failing companies. They are, in many cases, the most important companies in the climate tech ecosystem — the ones that have already done the hard work of validation and are ready to generate real-world impact at scale if capital is available. Most of the time, it isn’t. The Southeast Asia Dimension The missing middle problem exists globally, but it is acutely severe in Southeast Asia — and for reasons that compound in ways that don’t apply to European or North American climate tech ecosystems. Smaller average deal sizes. Southeast Asian climate tech companies raising $3–8 million — squarely in the missing middle range — represent a deal size that many global climate funds are structurally unable to deploy into efficiently. A $500 million fund cannot justify the due diligence and portfolio management overhead of a $4 million investment. The math doesn’t work. So deals that would easily find capital in larger markets go unfunded in SEA simply because they’re too small for the funds that could theoretically back them. Thinner local capital markets. The Southeast Asian institutional investor landscape for climate tech is still developing. Local pension funds, family offices, and endowments that back climate tech in the US or Europe are less active in the region. The density of capital willing to play in the missing middle is lower, making the gap proportionally wider. Higher perceived risk. International capital often perceives Southeast Asian markets as carrying additional regulatory, currency, and operational risk — even when the underlying climate technology is equivalent to comparable European or North American solutions. This risk perception compression pushes institutional investors further toward the safer end of the TRL spectrum, deepening the middle gap. The data tells the story. Between 2018 and June 2026, Southeast Asia attracted approximately $1.1 billion in total climate tech investment. The United States attracted more than that in a single quarter of 2025. The regional funding deficit is real —

What Patient Capital Actually Returns
The phrase “patient capital” gets used a lot in venture circles. Usually it’s positioning — a fund saying it won’t pressure founders to exit on a timeline that suits the fund life rather than the business. Most of the time it’s marketing copy. Sometimes it’s real. The distinction matters more than most founders realise when they’re choosing investors, and the data behind it is more compelling than the conversation around it suggests. Here’s the core finding: Southeast Asian venture funds with average hold periods of 7 years or longer generate net multiples approximately 3.1–3.4x. Funds in the same region with average hold periods under 4 years average closer to 0.9–1.1x net to LPs. The gap isn’t driven by sector choice or deal sourcing quality — it’s driven almost entirely by whether the fund had enough time for its best companies to reach their actual potential. That finding should change how founders think about which investor to take money from. It should also change how LPs think about the funds they back. What the Return Data Actually Shows The comparison between short-hold and long-hold VC performance in Southeast Asia isn’t a new debate, but the data has become clearer in the last two years as more funds have reached full realisation or near-realisation of their portfolios. Cambridge Associates’ annual venture benchmark data — available at https://www.cambridgeassociates.com/research/ — shows consistently that the top-quartile performing venture funds globally maintain portfolio companies for a median of 7.2 years from first investment to exit. Bottom-quartile funds, by comparison, show median hold periods of 3.8 years. The return differential between top and bottom quartile is not subtle: top-quartile funds generate net IRRs roughly 2.5 to 3 times higher than bottom-quartile funds from the same vintage. In Southeast Asia specifically, the dynamic is amplified because of two regional characteristics. First, the exit environment is less liquid than US or European markets — fewer IPO windows, fewer strategic acquirers operating at scale, and secondary markets still developing. A company that needs to exit in year four because the fund is approaching its deployment deadline is exiting into a thinner market and accepting worse terms. A company that can wait until year seven or eight exits when it’s genuinely ready and when market conditions support a fair valuation. Second, the best businesses in Southeast Asia take longer to build. Regulatory navigation, multi-market expansion, and the process of educating customers in markets where the product category is still developing — these are not two-year projects. A B2B SaaS company targeting Indonesian SMEs needs 18 months just to understand the buying process well enough to build the right sales motion. A climate tech company working in Vietnam needs 24 months of relationship-building with government procurement before a significant B2G contract is realistic. The fund that arrived with a 4-year deployment timeline and a 5-year hold expectation was never going to capture the full value of these businesses. The one willing to run a 9-year vehicle is. Why Founders Desperately Need Patient Partners — And Often Don’t Realise It Most first-time founders evaluate investors on three things: brand, check size, and how much they liked the partner. The one thing that has the most direct impact on their long-term outcome — fund life and hold period expectations — rarely comes up in the conversation at all. Here’s what actually happens when a founder takes capital from a fund with a short hold expectation that doesn’t align with their business timeline: The artificial milestone problem. The fund needs to show the portfolio company making progress toward an exit every 12–18 months. This creates pressure for the kind of metrics that look good in a deck — user growth, GMV, headline ARR — even when the underlying business health metrics (retention, unit economics, operational leverage) aren’t ready to support an exit at a price anyone would be happy with. Founders end up optimising for the wrong outcomes. The board dynamic shifts. As a fund approaches year 5 or 6 of a typical 10-year structure, the pressure to generate DPI (distributed capital) starts to dominate board conversations. Suddenly the investor who was a supportive partner in years 1–3 is the one asking every quarter whether the company has had any acquisition conversations. This shift is not personal — it’s structural. But it completely changes the nature of the investor-founder relationship. The Series B trap. When a fund with a short hold expectation needs an exit but the company isn’t ready to be acquired, the fallback is to push for a Series B that brings in a new investor who might eventually buy the company out. The result is dilution the founder didn’t need at a time that wasn’t optimal, managed by an investor whose timeline agenda was driving the decision. None of this happens with a fund that entered the investment with a realistic view of how long the business actually needs to reach its potential. The conversation never shifts from “how do we build the best company” to “how do we get to an exit.” Two Paths, Same Company — An Anonymized Case Study Consider two versions of the same B2B logistics technology company, Series A in Indonesia in 2021, $8M raised. Version A: Fund with 8-year expected hold. The investor’s thesis was that Indonesian logistics infrastructure would take 5–6 years to reach the maturity where the software layer became truly valuable. The board was explicitly aligned that the company should prioritise unit economics and customer depth over headline growth. By 2025, the company had 140 enterprise customers, 94% net revenue retention, and a waiting list. In 2026, a strategic acquirer paid $180M. Founder and employee equity returned approximately 4.7x on the invested capital. Version B: Fund with 4-year expected hold. Different investor, same vintage, similar deal terms. The fund needed to show portfolio progress by 2024 to support fundraising for their next vehicle. Board pressure pushed the company toward aggressive customer acquisition — GMV and user numbers that looked compelling but came at the expense of onboarding quality and retention. By 2024 the

The Founder’s Due Diligence Survival Guide: What Investors Check and When
Getting to a term sheet is hard. Getting through due diligence is where most deals die — not because founders can’t answer the questions, but because they didn’t know the questions were coming. This isn’t a problem of competence. Most Southeast Asian founders who lose deals in diligence are capable people building real businesses. The problem is information asymmetry. Investors run due diligence processes every month. Most founders go through one, maybe two, in their entire careers. The investor knows every trap in the room. The founder is walking in blind. This guide closes that gap. What follows is a plain-language breakdown of exactly what institutional investors in Southeast Asia check during due diligence, in roughly the sequence they check it, and what you need to have ready before any of it starts. The Due Diligence Timeline — What Actually Happens After You Get a Term Sheet The term sheet is not the finish line. It’s the starting gun for the most intensive scrutiny your business will face until you go public. Most founders assume due diligence is a document exchange — you send files, they review them, they wire the money. The reality is more layered. A standard Series A diligence process at a Southeast Asian institutional fund typically runs four to eight weeks and involves parallel workstreams that are happening simultaneously, often without the founder being aware of all of them. Here’s the rough sequence: Week 1–2: Business fundamentals review. The investor’s analyst team is building their own financial model from your numbers. They’re calculating metrics you may not have calculated yourself. They’re stress-testing your assumptions. This happens largely behind closed doors — you may not hear from the investor much during this period, which founders often misread as a bad sign. It usually isn’t. Week 2–4: Legal and corporate structure review. The investor’s lawyers are pulling your incorporation documents, cap table, IP assignments, employment agreements, and any existing contracts with customers, vendors, or advisors. This is where undisclosed complications surface. If there’s a shareholder dispute from two years ago, a vesting schedule that wasn’t properly documented, or a contractor who built core IP without signing an assignment agreement — it comes up here. Week 3–5: Reference checks. Investors are talking to people you didn’t introduce them to. Former employees, customers who churned, investors from your previous round, people who know you from before this company. This track runs quietly in the background while the legal and financial work is happening. Weeks 4 to 6: Financial model audit and deal structuring. When the business and legal analysis is almost done, the investor goes back to the financial model, incorporating changes due to their analysis and starts dealing with the deal structuring. Understanding this sequence matters because your job as a founder is different at each stage. In weeks one and two, you need clean financials that can be replicated by someone else. In weeks two through four, you need legal infrastructure that doesn’t surprise anyone. In weeks three through five, you need a reputation that survives conversations you’re not in. Business Fundamentals Every Investor Calculates Before Your First Meeting By the time a serious Series A investor in Southeast Asia sits down with you for a first meeting, their analyst has already built a preliminary model from whatever public information exists about your company — LinkedIn headcount, press releases, industry benchmarks. They know roughly what your burn rate should be. They have a range for what your ARR might be. They’ve estimated your CAC from your marketing spend. This means the first substantive conversation is not about introducing your numbers. It’s about whether your numbers match what they already expect — and where they don’t, explaining why. The specific metrics that get the deepest scrutiny: Revenue quality. Not just ARR — the composition of ARR. What percentage is multi-year contracted? What’s the split between monthly and annual commitments? Are there any customers representing more than 15–20% of total revenue (customer concentration risk)? Has any revenue been recognized that isn’t yet collected? Net Revenue Retention. This is the number that gets recalculated most often during diligence because founders frequently compute it differently from how investors do. NRR is expansion revenue plus contraction and churn, divided by starting period revenue, for the same cohort. If your best customers are growing but your average customers are flat or churning, your NRR tells a different story than your gross ARR growth. Burn multiple. Net burn divided by net new ARR — how much capital are you consuming to generate each dollar of new recurring revenue? A burn multiple above 2 at Series A creates questions. Above 3 is a significant concern in the current environment. Unit economics by customer segment. Not blended — by segment. Investors want to see whether your economics are good across the board or whether they’re carried by a subset of customers that aren’t representative of where you’re going. Churn by cohort. Monthly churn numbers can hide structural problems. A startup with 2% monthly churn looks tolerable until you see that all of the churn is concentrated in the 6–12 month customer cohort, which means the product is not delivering value past the honeymoon period. Team and Legal — The Surprises That Kill Deals Late The deals that die in the final week of diligence almost always die because of a legal or team-related issue that surfaced unexpectedly. These are the areas where founders most consistently underestimate the level of scrutiny. Cap table cleanliness. Every investor who has ever had a deal complicated by a messy cap table will spend disproportionate time checking yours. The specific things they’re looking for: is the cap table fully diluted and accurate? Are all vesting schedules properly documented and being tracked? Are there any uncapped convertible notes that could create unexpected dilution? Are there any shareholders whose contact information no one has, or who haven’t been heard from in years? Are there any side agreements with early investors or advisors that
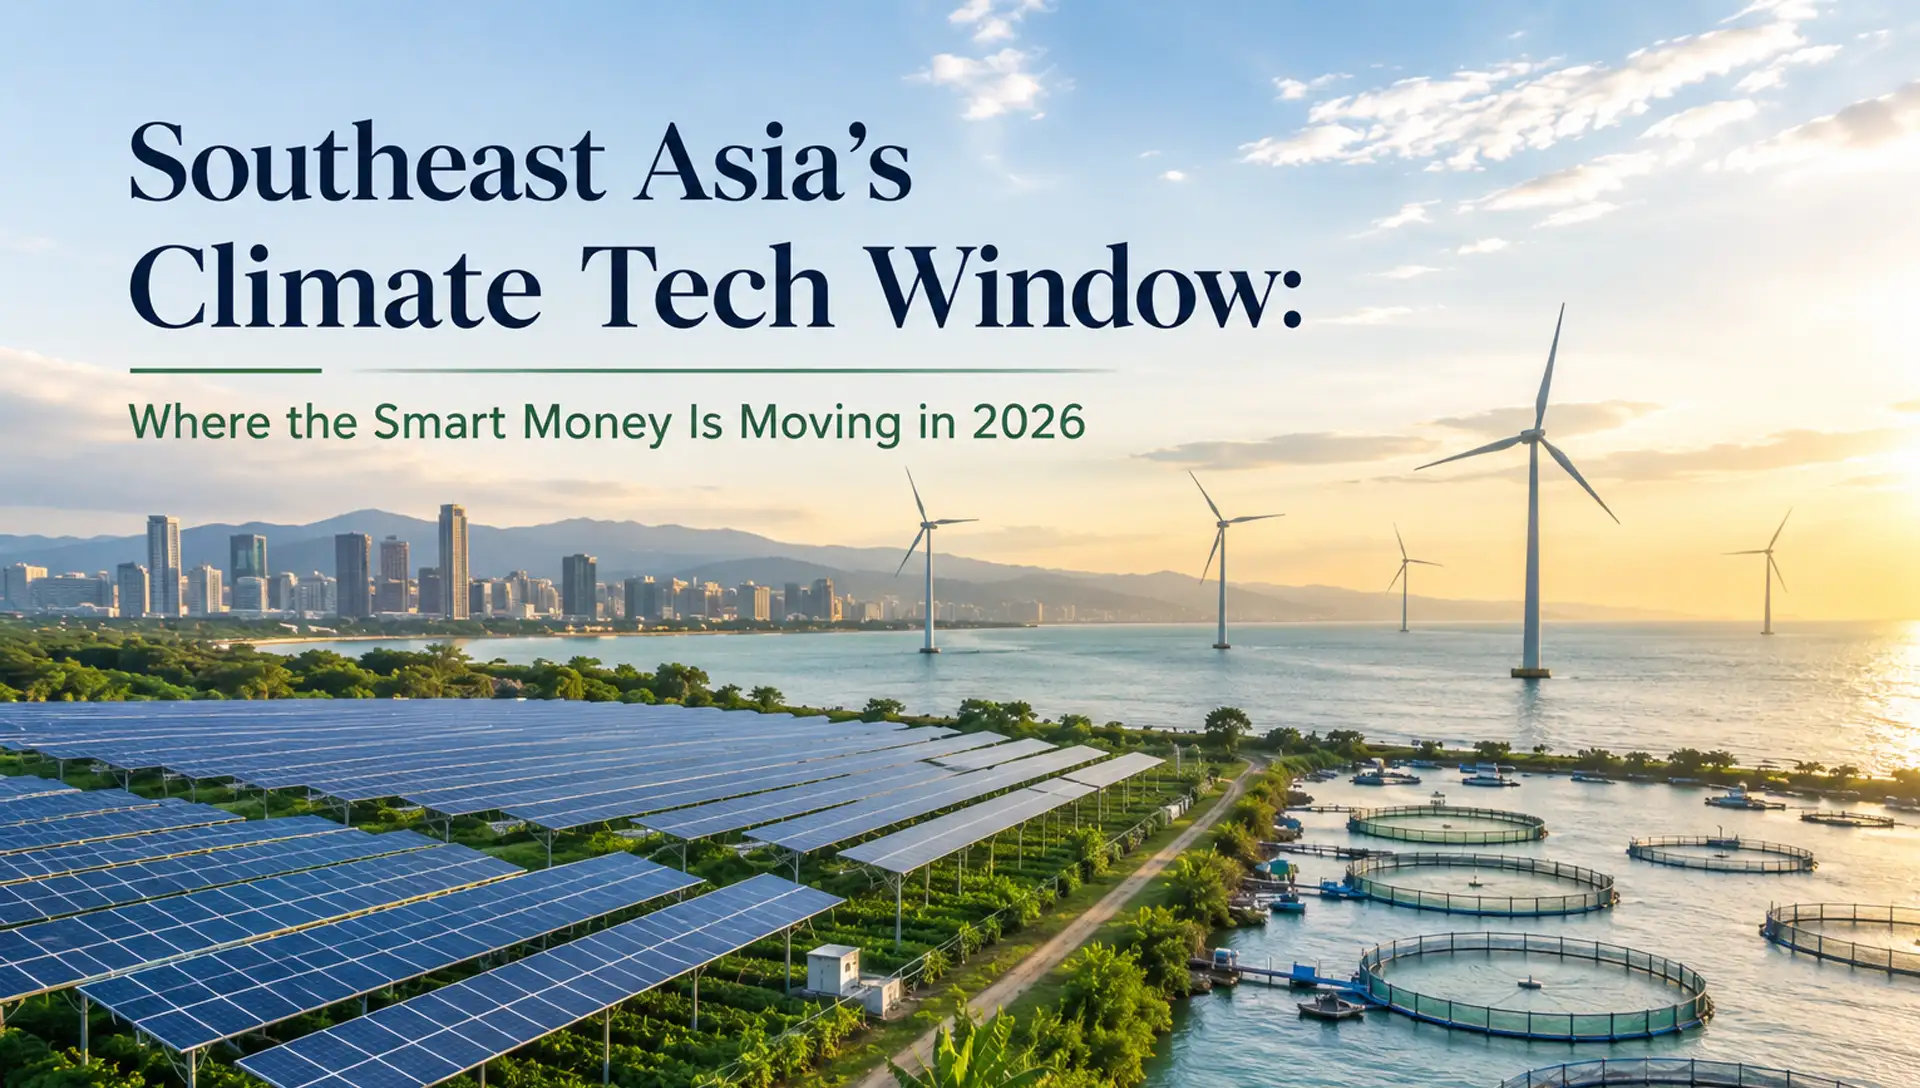
Southeast Asia’s Climate Tech Window: Where the Smart Money Is Moving in 2026
There’s a quiet reallocation happening in Southeast Asian venture capital right now, and most founders and fund watchers are missing it because they’re looking at the wrong data. The headline number — seed funding in SEA down roughly 50% from its 2022 peak — tells one story. But inside that compressed total, one category is moving against the trend: climate tech. Not because investors have become idealists. Because the numbers are starting to work in ways they didn’t three years ago. This piece is EVC’s analysis of where institutional capital is actually flowing in SEA climate tech in 2026, what’s driving it, and what fundable opportunities look like in the current environment. The Capital Rotation No One Is Talking About The 2024–2025 correction in Southeast Asian VC hit consumer tech, late-stage growth, and marketplace models hardest. These were the categories that attracted the most capital during the 2020–2022 expansion, and they’ve seen the sharpest pullback as investors recalibrated toward capital efficiency. What didn’t pull back — and in some sub-sectors actively expanded — was climate-adjacent infrastructure. The reason is structural: climate tech in Southeast Asia is increasingly intersecting with government procurement, bilateral development finance, and corporate sustainability mandates that create revenue certainty investors in the consumer tech space simply can’t access. A B2G (business-to-government) climate tech deal in Indonesia or Vietnam has a fundamentally different risk profile than a consumer subscription business in the same market. The contract sizes are larger, the relationships are stickier, and the regulatory tailwind — driven by net-zero commitments across ASEAN members — is creating demand that isn’t going away in a downturn. This doesn’t mean all climate tech is fundable. It means the specific intersection of climate technology, institutional revenue streams, and defensible IP is where disciplined investors are concentrating attention while pulling back everywhere else. The Blue Economy — $24 Trillion and Still 1% Funded The ocean economy — marine energy, sustainable aquaculture, blue carbon, marine biotech — represents what the KPMG Ocean Capital Report 2026 estimates at $24 trillion in addressable economic value globally. The venture capital investment into this space, globally, remains under 1% of what the category’s scale would imply. In Southeast Asia, that underinvestment is particularly stark — and the opportunity is particularly concentrated. The region contains some of the world’s most biodiverse and economically significant marine ecosystems: the Coral Triangle spanning Indonesia, Malaysia, and the Philippines; Vietnam’s 3,000-kilometer coastline; Thailand’s aquaculture economy; and Singapore’s emerging position as the hub for blue economy financial structuring. Three specific sub-sectors within the blue economy are attracting disproportionate early institutional attention: Sustainable aquaculture technology. Southeast Asia produces over 35% of the world’s farmed seafood. The technology stack — precision feeding, disease detection, water quality monitoring, logistics optimization — is still largely manual and fragmented. Startups applying IoT, sensor technology, and AI-assisted monitoring to existing aquaculture operations have clear, immediate customers and quantifiable ROI. This isn’t a “build the market” situation — the market is paying for this already, just from less sophisticated providers. Blue carbon credit infrastructure. The voluntary carbon market has seen significant volatility, but one category of credits has held value through the turbulence: blue carbon — credits generated by protecting or restoring coastal ecosystems including seagrasses, mangroves, and salt marshes. Southeast Asia holds approximately 33% of the world’s mangrove coverage. The infrastructure to measure, verify, issue, and trade blue carbon credits is still being built. The companies building that infrastructure — measurement platforms, verification methodologies, credit issuance technology — are fundable in a way that many offset-category investments are not. Ocean-based renewable energy logistics. Offshore wind is expanding rapidly across Vietnam, Taiwan, and the Philippines. The logistics, installation, and maintenance infrastructure for these assets is a massive, underserved market that requires deep regional knowledge to navigate. This is less “breakthrough technology” and more “critical infrastructure services” — which, from an investor’s perspective, is often more fundable than the headline innovation. Agrivoltaics — Why Arid Land Is Becoming a Premium Asset Agrivoltaics — the co-location of solar energy generation with agricultural activity on the same land — is one of the most underappreciated emerging categories in Southeast Asian climate tech. And it connects directly to one of the region’s most underutilized resources: dryland and semi-arid land that is currently either idle or marginally productive. The basic model works like this: elevated solar panels are installed over agricultural land at a height that allows farming below. The shading effect from the panels reduces water evaporation in the soil, which improves crop yields in arid conditions. The panels themselves generate renewable energy for local consumption or grid sale. The combination — improved agricultural productivity plus energy revenue on previously marginal land — creates an economics story that neither agriculture nor solar alone could tell. In the context of Southeast Asia, where Indonesia alone has approximately 14 million hectares of underutilized dryland, the potential scale is significant. Several pilots in Java and Sulawesi are showing dual-income outcomes that are commercially interesting at relatively modest capital deployment. The fundable opportunity here is primarily in the technology and services layer — precision farming systems designed for agrivoltaic conditions, monitoring platforms, project development expertise, and carbon credit methodology development — rather than in owning the land itself. What Fundable Climate Tech Actually Looks Like in 2026 Not all climate tech is fundable, and the category’s genuine importance doesn’t make every pitch investable. Based on current deal flow in SEA, three characteristics consistently define the climate tech companies that are closing rounds: Demonstrable unit economics that don’t depend on carbon credit prices. The companies raising money in 2026 have a primary revenue stream — equipment sales, service contracts, government procurement — and treat carbon credit revenue as upside, not as the core financial model. Climate tech that can show a compelling P&L without any carbon revenue, and then layer carbon revenue on top, is dramatically easier to fund. B2G revenue anchors in the pipeline. The most fundable climate tech startups in

The LP Relationship Playbook: What Fund Managers Get Wrong
Most fund managers spend 80% of their time thinking about deals — sourcing, diligence, term sheets, portfolio support. LPs spend 80% of their evaluation time thinking about the fund manager. Not the portfolio. Not the thesis slide. The person and the team writing the checks. That mismatch is at the center of why some funds raise their next vehicle with relative ease, while others — often with comparable returns — struggle. The good news: relationship management is a skill, not a personality trait, and it’s one most GPs have never been taught. The LP Evaluation Framework Most VCs Don’t Know Exists Institutional LPs don’t evaluate a fund the way a founder pitches an investor. They’re running a structured assessment, even when it doesn’t feel like one in the room, and three dimensions tend to dominate. GP track record specificity vs. category claims. “We have a strong track record in Southeast Asia” tells an LP almost nothing. “Across our last two funds, we led or co-led 60% of our Series A investments, and three of our top five performers came from founder relationships we’d built 12+ months before they raised” tells them everything. LPs are trained to discount category-level claims and weight specific, falsifiable detail. GPs who only have the former are, often without realizing it, signaling that they haven’t done the internal work of understanding their own edge. Portfolio construction logic vs. a portfolio of bets. LPs want to understand the system that produced the portfolio — check size discipline, reserve strategy, follow-on decision criteria, sector and stage concentration limits. A portfolio that reads as “a collection of good companies we liked” versus “the output of a repeatable process” sends very different signals about whether performance is repeatable in Fund III, IV, or V. Communication quality through down cycles. This is the dimension most GPs underweight — and the one LPs weight most heavily, because it’s the only one they can observe in real time, before returns are even knowable. How a GP communicates when a portfolio company is struggling, when markdowns happen, when the macro environment turns — that behavior is the single best predictor LPs have of how a GP will behave with their capital during the next downturn. The 78% Statistic That Should Change How You Run Your Fund According to Preqin’s 2026 LP Survey, approximately 78% of LP re-up decisions in Asia are driven primarily by relationship quality with the GP — not by fund performance metrics alone. This number tends to surprise GPs the first time they hear it, because it seems to contradict the idea that venture is a returns-driven business. It doesn’t contradict it. It explains how LPs actually assess returns. Performance numbers in venture are lagging, noisy, and — especially in early-stage funds — largely unrealized for years. An LP cannot fully evaluate a Fund II’s performance until well into Fund III’s life. What they can evaluate, continuously, is whether the GP communicates clearly, honestly, and consistently about what’s happening inside the portfolio. What “relationship quality” actually means to institutional LPs. It is not warmth, charm, or how enjoyable annual meetings are — though those don’t hurt. It is, specifically: Does this GP tell me what I need to know, when I need to know it, in a way I can act on? Do they flag problems before I read about them elsewhere? Do their updates help me do my job — reporting to my own investment committee — or create more work for me? The difference between quarterly reports and quarterly conversations. A quarterly report is a document. A quarterly conversation is a relationship touchpoint where an LP can ask follow-up questions, get color on a markdown, and — critically — observe how the GP handles being asked a hard question live. Funds that rely solely on the document, without the conversation, are leaving the most relationship-building part of LP communication unused. The 5 Communication Failures That Cost VCs Their LP Base These five patterns show up repeatedly in LP feedback on underperforming GP relationships — and every one of them is fixable without changing a single investment decision. 1. Over-reporting wins, under-reporting challenges. A portfolio update that’s 90% “here’s our latest unicorn markup” and silent on the three companies that are struggling doesn’t read as optimism to an LP — it reads as either denial or selective disclosure. Both erode trust faster than the bad news itself would. 2. Inconsistent update cadence. LPs build their own internal reporting cycles around when they expect to hear from GPs. A fund that sends detailed updates quarterly for a year, then goes silent for two quarters during a hard stretch, confirms the worst assumption an LP can make: that communication frequency correlates with how good the news is. 3. Generic investor updates not tailored to LP type. A family office LP, a fund-of-funds LP, and a sovereign-wealth-aligned LP are evaluating the same update through different lenses — liquidity timelines, co-investment interest, reporting requirements to their own stakeholders. A single generic update that ignores these differences misses the chance to make each LP relationship feel individually managed. 4. Missing the emotional intelligence layer. Numbers without context leave LPs to construct their own narrative — which is often more negative than reality. A markdown explained with “here’s what happened, here’s what we’re doing, here’s why we still believe in the team” lands completely differently than the same markdown presented as a bare number in a spreadsheet. 5. Treating LPs as capital sources rather than partners. LPs increasingly expect to be looped into portfolio company introductions, co-investment opportunities, and even informal market intelligence — not because they need the favor, but because it signals the relationship runs in both directions. GPs who only reach out when raising the next fund make that extractive dynamic obvious. What High-Retention Fund Managers Do Differently The GPs with the highest LP re-up rates share a small number of practices — none of which require additional headcount or a bigger

The Singapore Cap Table: Structure, Norms, and the Mistakes That Kill Rounds
Cap table management doesn’t get discussed nearly enough in Southeast Asia’s founder community — until it starts killing rounds. We’ve sat across the table from founders raising Series A and B who had done everything right in their business but had cap tables that made institutional investors uncomfortable. Not because the numbers were wrong. Because the structure was messy: too many early angels with no lead and no pro-rata clarity, convertible notes with aggressive valuation caps, ESOP pools that hadn’t been refreshed, or dual-class share arrangements with no sunset provisions. In Singapore specifically, cap table conventions sit somewhere between US venture norms and the more relationship-driven structures common in India. Understanding where Singapore sits — and what the institutional venture capital firms in Singapore expect to see at each stage — is critical for any founder raising in the SEA corridor. This is what we look at, what we’ve seen go wrong, and what a clean Singapore cap table should look like at every stage of growth. What a Singapore Cap Table Actually Is — and Why It’s Not Just a Spreadsheet A capitalisation table — cap table — is a legal record of equity ownership in a company. In Singapore, it reflects ordinary shares, preference shares, convertible instruments (SAFEs, convertible notes), ESOPs, and any warrants issued. At incorporation, a Singapore company is registered under the Companies Act with the Accounting and Corporate Regulatory Authority (ACRA). Share issuances, transfers, and shareholder agreements must align with the company’s constitution provisions and are legally binding records. What most early-stage founders misunderstand is that a cap table is not merely a financial record — it is a governance document. It tells investors who has decision-making rights, who can block transactions, who has information rights, and who dilutes whom under what circumstances. A cap table with 15 individual angel investors, no lead, and no coordinated shareholder agreement is not just administratively messy — it is a genuine material risk to every future fundraising round. Stage-by-Stage: What the Cap Table Should Look Like Pre-Seed At pre-seed, a Singapore cap table is typically clean: founder shares (usually split between 2–3 co-founders), a small ESOP pool (5–10%), and one or two early angels or a pre-seed fund. The most common error at this stage is founders issuing shares directly to early advisors, friends-and-family investors, or mentors without proper documentation — or at inconsistent valuations. By the time a seed or Series A investor reviews the cap table, they see fragmented ownership with no documentation trail. This raises questions about governance discipline that are difficult to answer convincingly under due diligence pressure. Use a SAFE (Simple Agreement for Future Equity) for early informal investment wherever possible. It delays the valuation conversation to a point where founders have more negotiating leverage, and it keeps the formal cap table clean until a priced round is warranted. Seed Stage A well-structured Singapore seed round typically involves 1–3 institutional or semi-institutional investors — angel syndicates, family offices, or seed funds — an ESOP pool of 10–15%, and a shareholder agreement that clearly defines information rights, pro-rata rights, and reserved matters requiring investor approval. At this stage, as an early-stage VC in Singapore, we look at the following: Is there a lead investor, or is the round fragmented across 8–10 individuals with no coordination mechanism? Has the ESOP pool been sized to accommodate hiring through Series A without requiring a separate re-approval vote? Do any convertible instruments carry aggressive valuation caps that will create significant founder dilution at the next priced round? Is there a drag-along provision allowing a majority of shareholders to force a sale, or does one small early investor have effective blocking rights? The cleanest seed rounds in Singapore are those where a credible lead has been established, documentation is NVCA-aligned or Singapore-adapted equivalent, and founders retain meaningful control through a clearly structured preference share or dual-class arrangement with fair governance provisions. Series A and Beyond By Series A, institutional investors — particularly those from the US or managing US LP capital — will want to see a clean preference share stack. In Singapore, this typically means: participating or non-participating preferred shares with a 1x liquidation preference, anti-dilution provisions using weighted average methodology (not full ratchet), board composition clearly documented (typically 2 founder seats, 1 lead investor seat, 1 independent at Series A), option pool refreshed before the round closes, and all prior convertible instruments converted or resolved. The Monetary Authority of Singapore (MAS) framework and guidance published by the Singapore Venture and Private Capital Association (SVCA) provide useful benchmarks for best-practice term sheet structures for Singapore-incorporated entities. Founders entering Series A negotiations should be familiar with both before sitting down at the table. The 5 Cap Table Mistakes That Kill Singapore Rounds 1. Too Many Angels with No Lead and No Pro-Rata Clarity When a seed round has 12+ individual investors with small cheques, no lead, and no coordinated shareholder agreement, Series A investors face a structural coordination problem. Passing reserved matters resolutions, issuing new shares, or executing an acquisition requires majority consent — and reaching 14 individual angels across different time zones is operationally costly and genuinely risky. More subtly, it signals that the founders were unable to attract a credible lead. That signal, however soft, registers with every investor who reviews the cap table. The fix: consolidate early angels into an SPV (Special Purpose Vehicle) wherever possible. One SPV means one cap table entry, one signature on shareholder resolutions, one coherent voice in investor communications. 2. Convertible Notes with Aggressive Valuation Caps A convertible note with a $500K valuation cap converting at Series A when the company is priced at $6M creates enormous founder dilution and signals to incoming investors that the company took aggressive terms under funding pressure. Y Combinator’s SAFE documentation recommends uncapped SAFEs with MFN (Most Favoured Nation) clauses for early-stage rounds where possible. This structure is increasingly adopted by sophisticated Singapore seed funds. If you have outstanding notes with aggressive caps, the

The Founder Pre-Pitch Checklist: What VCs Check Before You Get in the Room
Most founders prepare a deck. Few prepare what matters before the deck opens. You spent three weeks on your pitch deck. You rehearsed the delivery. You got the intro. Here’s what we did before your calendar invite even landed: we Googled you. Then we looked at your LinkedIn activity. Your co-founder’s background. The round history. The cap table. Your last company, if there was one. This happens in the 20 minutes before the call. It shapes the tone of every question we ask. And most founders have no idea it’s happening. This is the pre-pitch checklist — the one we run silently, before you say hello. Singapore’s VC ecosystem runs on reputation before revenue. Institutional LPs, family offices, and co-investors all talk. Your story arrives before you do. 1. Your Digital Footprint Has an Opinion We’re not looking for perfection. We’re looking for a signal. Inconsistent LinkedIn dates, a co-founder who went quiet six months ago, a domain registered last week — these aren’t disqualifiers, but they start the mental clock. What we want to see: a founder who’s been living this problem for a while. Someone whose online presence tells a coherent story — even if it’s a startup story with bruises. Fix: Align your narrative. LinkedIn, website, press mentions — they should all read as the same person building the same mission. 2. Your Cap Table Is Already Public Not literally. But if you’ve done previous rounds, your investors talk to us. We’ll know the structure before you show us the slide. We’re checking for red flags: too many small angels with no lead, unusual dilution, a previous investor who didn’t follow on. That last one quietly kills deals. Fix: If there’s something awkward on your cap table, address it in the first five minutes. Proactively. VCs respect founders who control their narrative. 3. Your Last Company (or Job) Tells Us How You’ll Handle This One We look at your exit, not just your entry. How did your last company end? If it failed — and many do — how did you treat investors, employees, vendors? Founders think we don’t know. We usually do. In Singapore’s tightly networked ecosystem, the community remembers. How you handled failure is often more informative than how you handled success. Fix: Own your history. A founder who can explain a shuttered startup with honesty and self-awareness scores higher than one with a spotless but shallow track record. 4. Team Depth — Or the Absence of It We’re checking: can this team actually build what they’re describing? In Singapore’s startup funding ecosystem, technical co-founders are harder to find than capital. If you’re a solo non-technical founder pitching a deep-tech product, that’s a real risk we price in. We also look at team tenure on the current company. If three key hires left in the last year, we’ll ask about it. Quietly, indirectly — but we’ll ask. Fix: If there are gaps, name them and your plan to fill them. Vague team slides with no faces and roles are worse than honest gaps. 5. The Market You Claim vs. The Market You’re Actually In Every deck says ‘$40 billion addressable market.’ We open a second tab and check. We look at ASEAN-specific data, recent deals in the space, and what the actual competitors — often undisclosed in decks — have raised. Founders who cite global TAM for what is clearly a Southeast Asia play lose the room. Singapore’s VC community funds precision, not ambition dressed as data. Fix: Build your TAM from the bottom up. Show us the specific segment you’ll win first, then the path to the bigger number. Sequence matters. 6. Your Traction Is Visible Before You Show the Slide App stores, ProductHunt, press, LinkedIn mentions, web traffic tools — we check. Not to catch you, but because real traction leaves a trail. If your deck says 10,000 users but Product Hunt never heard of you and your site gets 40 visitors a month, that gap has to be explained. Fix: Ensure your traction story has public evidence. Even a single well-documented case study beats a slide full of logos we can’t verify. The Point Isn’t to Be Perfect The point is to not be surprised. Every item on this checklist is something we’ve seen derail a promising conversation — not because the business was bad, but because the founder walked in blind to how we were reading the room before they arrived. Raising capital for a startup in Singapore is a process, not a meeting. Your preparation starts weeks before you pitch — and so does ours. The best founders we’ve backed weren’t the most polished. They were the most honest — about what they had, what they didn’t, and exactly why they were the right people to solve this problem. Evolve Venture Capital invests in early-stage founders across Southeast Asia. If you’re raising, start by reading the room — before the room reads you.

How the Singapore–India VC Corridor Is Reshaping Asia’s Startup Capital Flows in 2026
The smartest LPs you’ve never heard of trimmed their China exposure in late 2024. They didn’t tell anyone. By Q2 2025, three Singapore family offices we work with had quietly re-weighted around 18% of their Asia VC allocation toward what we call the Singapore-India corridor. By the time the rest of the market caught the story — sometime around the 2025 Super Return Asia panel circuit — the early movers were already up double digits, and the rest of you were still being told the 2022 playbook still worked. It doesn’t. If your Asia VC allocation is still running on the thesis you locked in three years ago, you’re not being conservative. You’re being mispriced. This piece is the practical map of what the corridor actually is, where the capital is now flowing, the three allocation shifts the smart money has already made, and the four sectors that will decide whether your 2030 returns look like 6× or like 1.4×. It’s not for founders. It’s for the allocators rethinking their next commit. Why the old Asia VC playbook broke in 2026 The 2022 Asia VC thesis was, broadly, a 60/30/10 allocation: 60% China, 30% India + SEA, 10% Japan/Korea. It assumed three things: that Chinese tech IPO windows would re-open, that India’s rupee depreciation was a temporary input, and that Southeast Asia’s startup ecosystem would mature on roughly the same timeline as India’s did between 2014 and 2019. Each of those assumptions broke between 2023 and 2025. The Chinese IPO window for VC-backed tech didn’t re-open in any meaningful way — Hong Kong listings recovered partially, US listings remained selectively closed for sensitive sectors, and the secondary market discount for China-exposed funds widened to levels that made marks look fictitious. Allocators who held to the 60% China weight saw IRRs compress, while their distributions stayed deferred. India’s rupee story moved the other way. By late 2024, dollar funds investing into Indian startups were enjoying a tailwind from currency stability, the maturation of UPI as a distribution layer, and recent data showing record commitments to early-stage Indian VC funds. Southeast Asia, meanwhile, finally got its secondaries market. Not because the public exits arrived — they mostly didn’t — but because the infrastructure for fund-of-funds and continuation vehicles caught up with the fact that 2018-vintage SEA funds were now in their distribution years. Liquidity unlocked. Allocators who believed they’d be locked into 12-year horizons discovered they could actually trade. The corridor is what these three shifts produced together. Singapore as the legal-and-capital home, India as the talent-and-distribution engine. Neither alone matches what they do as a pair. What the Singapore-India corridor actually is — and why the pair beats either alone When we say “the corridor,” we don’t mean geography. We mean a stack. A typical corridor company today incorporates in Singapore — often with a Variable Capital Company (VCC) structure for the holding entity — but builds its product and revenue engine in India. Engineering team in Bengaluru or Hyderabad. Sales motion split between Indian SMEs (volume) and Singapore-headquartered enterprise customers (margin). Capital raised in USD, deployed in INR, hedged where it matters. This isn’t novel structurally. What’s new in 2026 is how fast the corridor compresses go-to-market timelines. A pre-corridor SaaS company building for Asia might spend 18 months getting product-market fit in India, then another 12 months internationalising into Singapore-headquartered enterprise accounts. Total: 30 months to meaningful USD revenue. A corridor-native company, in our portfolio data, runs both motions concurrently from month one. The Singapore HQ gives it banking, payment rails, and credibility to close enterprise pilots from day one. The India engineering base lets it ship fast enough that those pilots actually convert. Median time to first $100K USD ARR: 14 months. Median time to first $1M ARR: 26 months. (Anonymised, our portfolio Q1-Q4 2025.) What this means for an allocator: the corridor is structurally faster on revenue compounding than either standalone India or standalone SEA. That’s the input. The output is shorter time-to-distribution at the fund level — and, when the fund is run by a manager who’s deliberately corridor-positioned rather than just opportunistically India-curious, lower DPI risk. Standalone India funds are great. Standalone SEA funds are great.The pair, run as a single thesis, is structurally different. That’s why the dollar volume flowing into corridor-positioned funds in 2025 has grown meaningfully faster than standalone India and Southeast Asia funds, while standalone-India and standalone-SEA fund flows grew at a fraction of that pace. Where the corridor money is actually moving — sector + stage breakdown Stage-wise, the corridor is heavily weighted toward seed and Series A. Not because growth-stage capital has dried up — it hasn’t — but because the corridor structural advantage compounds most aggressively in the first 24 months of a company’s life. By Series B, the Singapore HQ premium is already priced in. Sector-wise, the 2025 deployment data we track tells a clear story. Four sectors dominated: AI infrastructure for emerging-market enterprise (28% of our tracked deployments). Not foundation models. The boring layer underneath — fine-tuning workflows, vector databases tuned for Indian-language data, RAG pipelines for compliance-heavy verticals like banking and insurance. India has the engineering depth; Singapore has the enterprise customers willing to pay USD. Climate tech with credit-revenue dual models (22%). India’s rooftop solar, water-reuse infrastructure, and battery-recycling sectors got newly bankable in 2024 because of carbon-credit revenue streams that finally stabilised. Singapore-incorporated entities can sell those credits internationally; the India engineering layer builds the actual hardware. Cross-border fintech for the Indian diaspora and SME export trade (19%). Not retail consumer fintech (saturated). Cross-border payments, trade finance, embedded finance for Indian SMEs exporting into SEA and the Middle East. UPI plus Singapore’s payment-rails maturity is a moat. Vertical SaaS for Asia-specific industries (16%). Logistics for India’s port modernisation push, healthtech for Singapore’s aging demographic exported to India’s tier-2 hospital chains, agritech for Southeast Asia’s smallholder farmer financing. The remaining 15% is a long tail of cybersecurity, deep-tech, and selective web3 plays
